
Platform Subscription &
Dashboards
Your subscription to the Confer Analytics® platform offers tremendous value and flexibility for the competitive subscription price of $5,450/year. As a subscriber, you have access to the most comprehensive business intelligence available for the home care market, enabling you to effectively allocate resources and achieve the growth and quality needed to succeed.
- Home-Based Primary Care
- Hospice and Palliative Care
- Home Health
- Hospital at Home
- Virtual Care at Home
Sample Reports
Practices and Clinicians
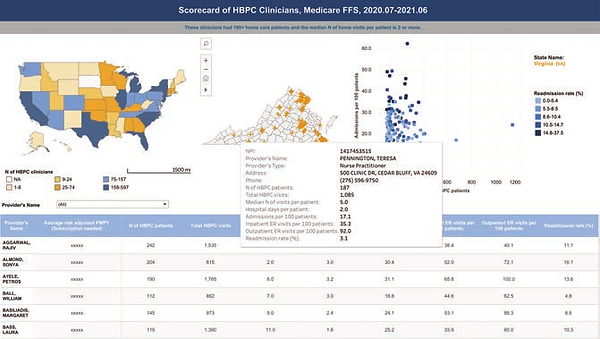
With your Confer Analytics® subscription, you can assess the HBMC workforce supply (and potential competitors) in a particular region, including:
-
Volume of practices
-
The volume of providers by specialty
-
Number of home visits made annually per provider or practice
-
Number of patients served annually per provider or practice
-
Payer mix
-
Provider performance and quality metrics
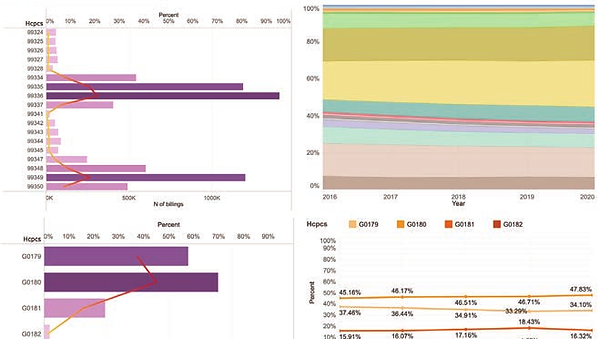
Billing Codes
Patient Volumes and Drive-Time Analysis
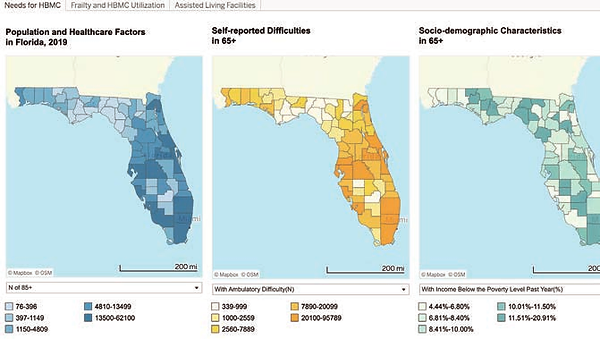
With your Confer Analytics® subscription, you can identify where there are high volumes of older adults or high-needs patients living in private residences or assisted living facilities and evaluate your proposed service area by applying a maximum drive time from a central location.
Frailty and Social Determinants of Health
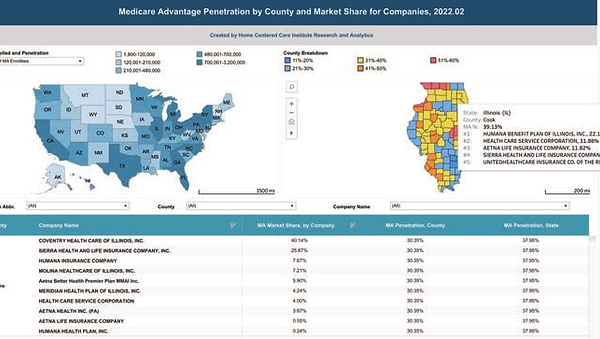
Medicare Advantage Payer Mix and Market Share
With your Confer Analytics™ subscription, you can see the penetration of Medicare Advantage (MA) plans by county, compare numbers of traditional Medicare beneficiaries versus MA beneficiaries, and view the top MA plans in that area, including company name and market share.
Our standard dashboards include:
Demand
Home-Based Medical Care Penetration Rates by Patients' Characteristics in the US
A dashboard providing a comprehensive view of the distribution and usage rates of home-based medical care (HBMC) services across various patient demographics within the US.
Older Adults in the US and Characteristics, by Zip Code
A dashboard illustrating details of older adults (by zip code) who would benefit from home-based medical care, based on age, self-reported difficulties, socio-economic demographics, and other factors.
Older Adults in the US and Their Characteristics, by County
A dashboard illustrating details of older adults (by county) who would benefit from home-based medical care based on age, self-reported difficulties, socio-economic demographics, and other factors.
Pattern of Care for High-Needs Patients (HNP)
A dashboard set that contains county-level data on the number of high-needs patients, the number of high-needs patients who are currently receiving HBMC and from which programs, and the office-based providers for patients who are not currently receiving HBMC.
Supply and Performance
Clinician Affiliations with HBMC Programs Medicare FFS
A dashboard that compiles data on clinicians who are affiliated with various home-based medical care (HBMC) programs operating within traditional Medicare.
Market Share of HBMC by Metropolitan Area, County, and Organization
A dashboard providing insights into the distribution, dominance, and market share of HBMC programs within different geographic areas across Metropolitan Areas and counties.
Market Share of HBMC by Metropolitan Area, County, and Provider
A dashboard providing insights into the distribution of HBMC clinicians within different geographic areas across Metropolitan Areas and counties, and key market share data.
Scorecard of HBMC Clinicians, Medicare FFS
A dashboard set that shows HBMC clinicians' performance within traditional Medicare, including clinician information of attributed patients, patient risk levels, performance measures including healthcare costs, hospitalization rates, readmission rates, and other quality indicators.
Scorecard of HBMC Practices or Programs, Medicare FFS
A dashboard set that allows users to compare the performance of different HBMC programs for benchmarking and identifying best practices within traditional Medicare, including program name and NPI, number of attributed patients, patient risk levels, performance measures including healthcare costs, hospitalization rates, readmission rates, and other quality indicators.
Partners, Referrals, and Billing
Assisted Living Facilities in the US
A dashboard providing information about assisted living facilities across the United States, including their locations, number of beds, and contacts.
Billing Codes used in HBMC in the US, FFS Medicare
A dashboard presenting billing codes used in HBMC for Fee-for-Service (FFS) or traditional Medicare, facilitating efficient healthcare billing and claims management.
HBMC Referrals and HBMC Patient Leakage Sources and Destinations by State, FFS Medicare
A dashboard showing the sources and destinations of HBMC referrals by state under traditional Medicare, highlighting trends in patient referrals.
Medicare Advantage
Patient Profiles of HBMC Practices/Programs, Medicare Advantage
A dashboard detailing patient profiles (demographics, risk level, and chronic conditions) of HBMC practices or programs under Medicare Advantage.
Patient Profiles of HBMC Providers, Medicare Advantage
A dashboard detailing patient profiles (demographics, risk level, and chronic conditions) of HBMC clinicians under Medicare Advantage.
Market Share of HBMC by Metropolitan Area, County, and Organization
A dashboard displaying the market share of HBMC within different geographic areas and organizations.
Market Share of HBMC by Metropolitan Area, County, and Provider
A dashboard displaying the market share of HBMC within different geographic areas and clinicians.
Medicare Advantage Penetration by County and Market Share for Companies
A dashboard showing Medicare Advantage penetration by county and market share by company.
Older Adults in the US and Their Characteristics, by County Level (2020-2021)
View details of older adults (by county) who would benefit from home-based medical care based on age, self-reported difficulties, socio-economic demographics, etc.
Hospice
Provider-Hospice Referrals, Medicare FFS
A dashboard providing information on referrals from individual providers to hospice agencies under traditional Medicare, as well as key quality metrics for these hospice agencies.
Organization-Hospice Referrals, Medicare FFS
A dashboard providing information on referrals from healthcare organizations to hospice agencies under traditional Medicare, and key quality metrics for these hospice agencies.
Hospice Programs by Patient County and Their Performance, Medicare FFS
A dashboard depicting hospice programs, their locations, and comprehensive performance metrics by county under traditional Medicare.
Percent of Decedents Enrolled in Hospice at the Time of Death Medicare FFS
A dashboard showing the percentage of decedents enrolled in hospice care at the time of their death under traditional Medicare.
Organization-Hospice Referrals, Medicare FFS and MA
A dashboard illustrating referrals from healthcare organizations to hospice agencies within both traditional Medicare and Medicare Advantage.
Provider-Hospice Referrals, Medicare FFS and MA
A dashboard illustrating referrals from individual providers to hospice agencies within both traditional Medicare and Medicare Advantage.
Home Health
Home Health Programs by Patient County and Their Performance Medicare FFS
A dashboard showcasing home health programs, comprehensive performance measures, and patient distribution by county under traditional Medicare.
Home Health Referral by Patient's County of Residence Medicare FFS
A dashboard set that includes information on home health referrals based on the patient's county of residence under traditional Medicare, as well as key quality metrics for these home health agencies
Older Adults in the US and Their Characteristics, by County Level
View details of older adults (by county) who would benefit from home-based medical care based on age, self-reported difficulties, socio-economic demographics, etc.
Virtual Care
Virtual Care (VC) by Clinician and Patient County, Medicare FFS
A dashboard depicting the utilization of virtual care services by clinicians and patients by county under traditional Medicare.
Virtual Care (VC) by Organization and Patient County, Medicare FFS
A dashboard showing the utilization of virtual care services by healthcare organizations and patients by county under traditional Medicare.
Virtual Care (VC) by Clinician and Patient County, Medicare Advantage
A dashboard showing the use of virtual care services by clinicians and patients, by county under Medicare Advantage.
Virtual Care (VC) by Organization and Patient County, Medicare Advantage
A dashboard depicting the utilization of virtual care services by healthcare organizations and patients, by county under Medicare Advantage.
Hospital at Home
Performance of Hospital at Home Programs
A dashboard presenting metrics (admissions, readmissions, payments) and insights related to the performance of Hospital at Home programs across the US.
Attending Physician of Hospital at Home Programs
A dashboard showing information about the attending physicians (NPI, name, specialty) involved in Hospital at Home programs (NPI, name) across the US.
CMS Approved Hospital at Home Programs
A dashboard illustrating details about Hospital at Home programs approved by the Centers for Medicare & Medicaid Services (CMS).
Summary Statistics of Hospital at Home Programs
A dashboard presenting key summary statistics and insights related to Hospital at Home programs across the US.